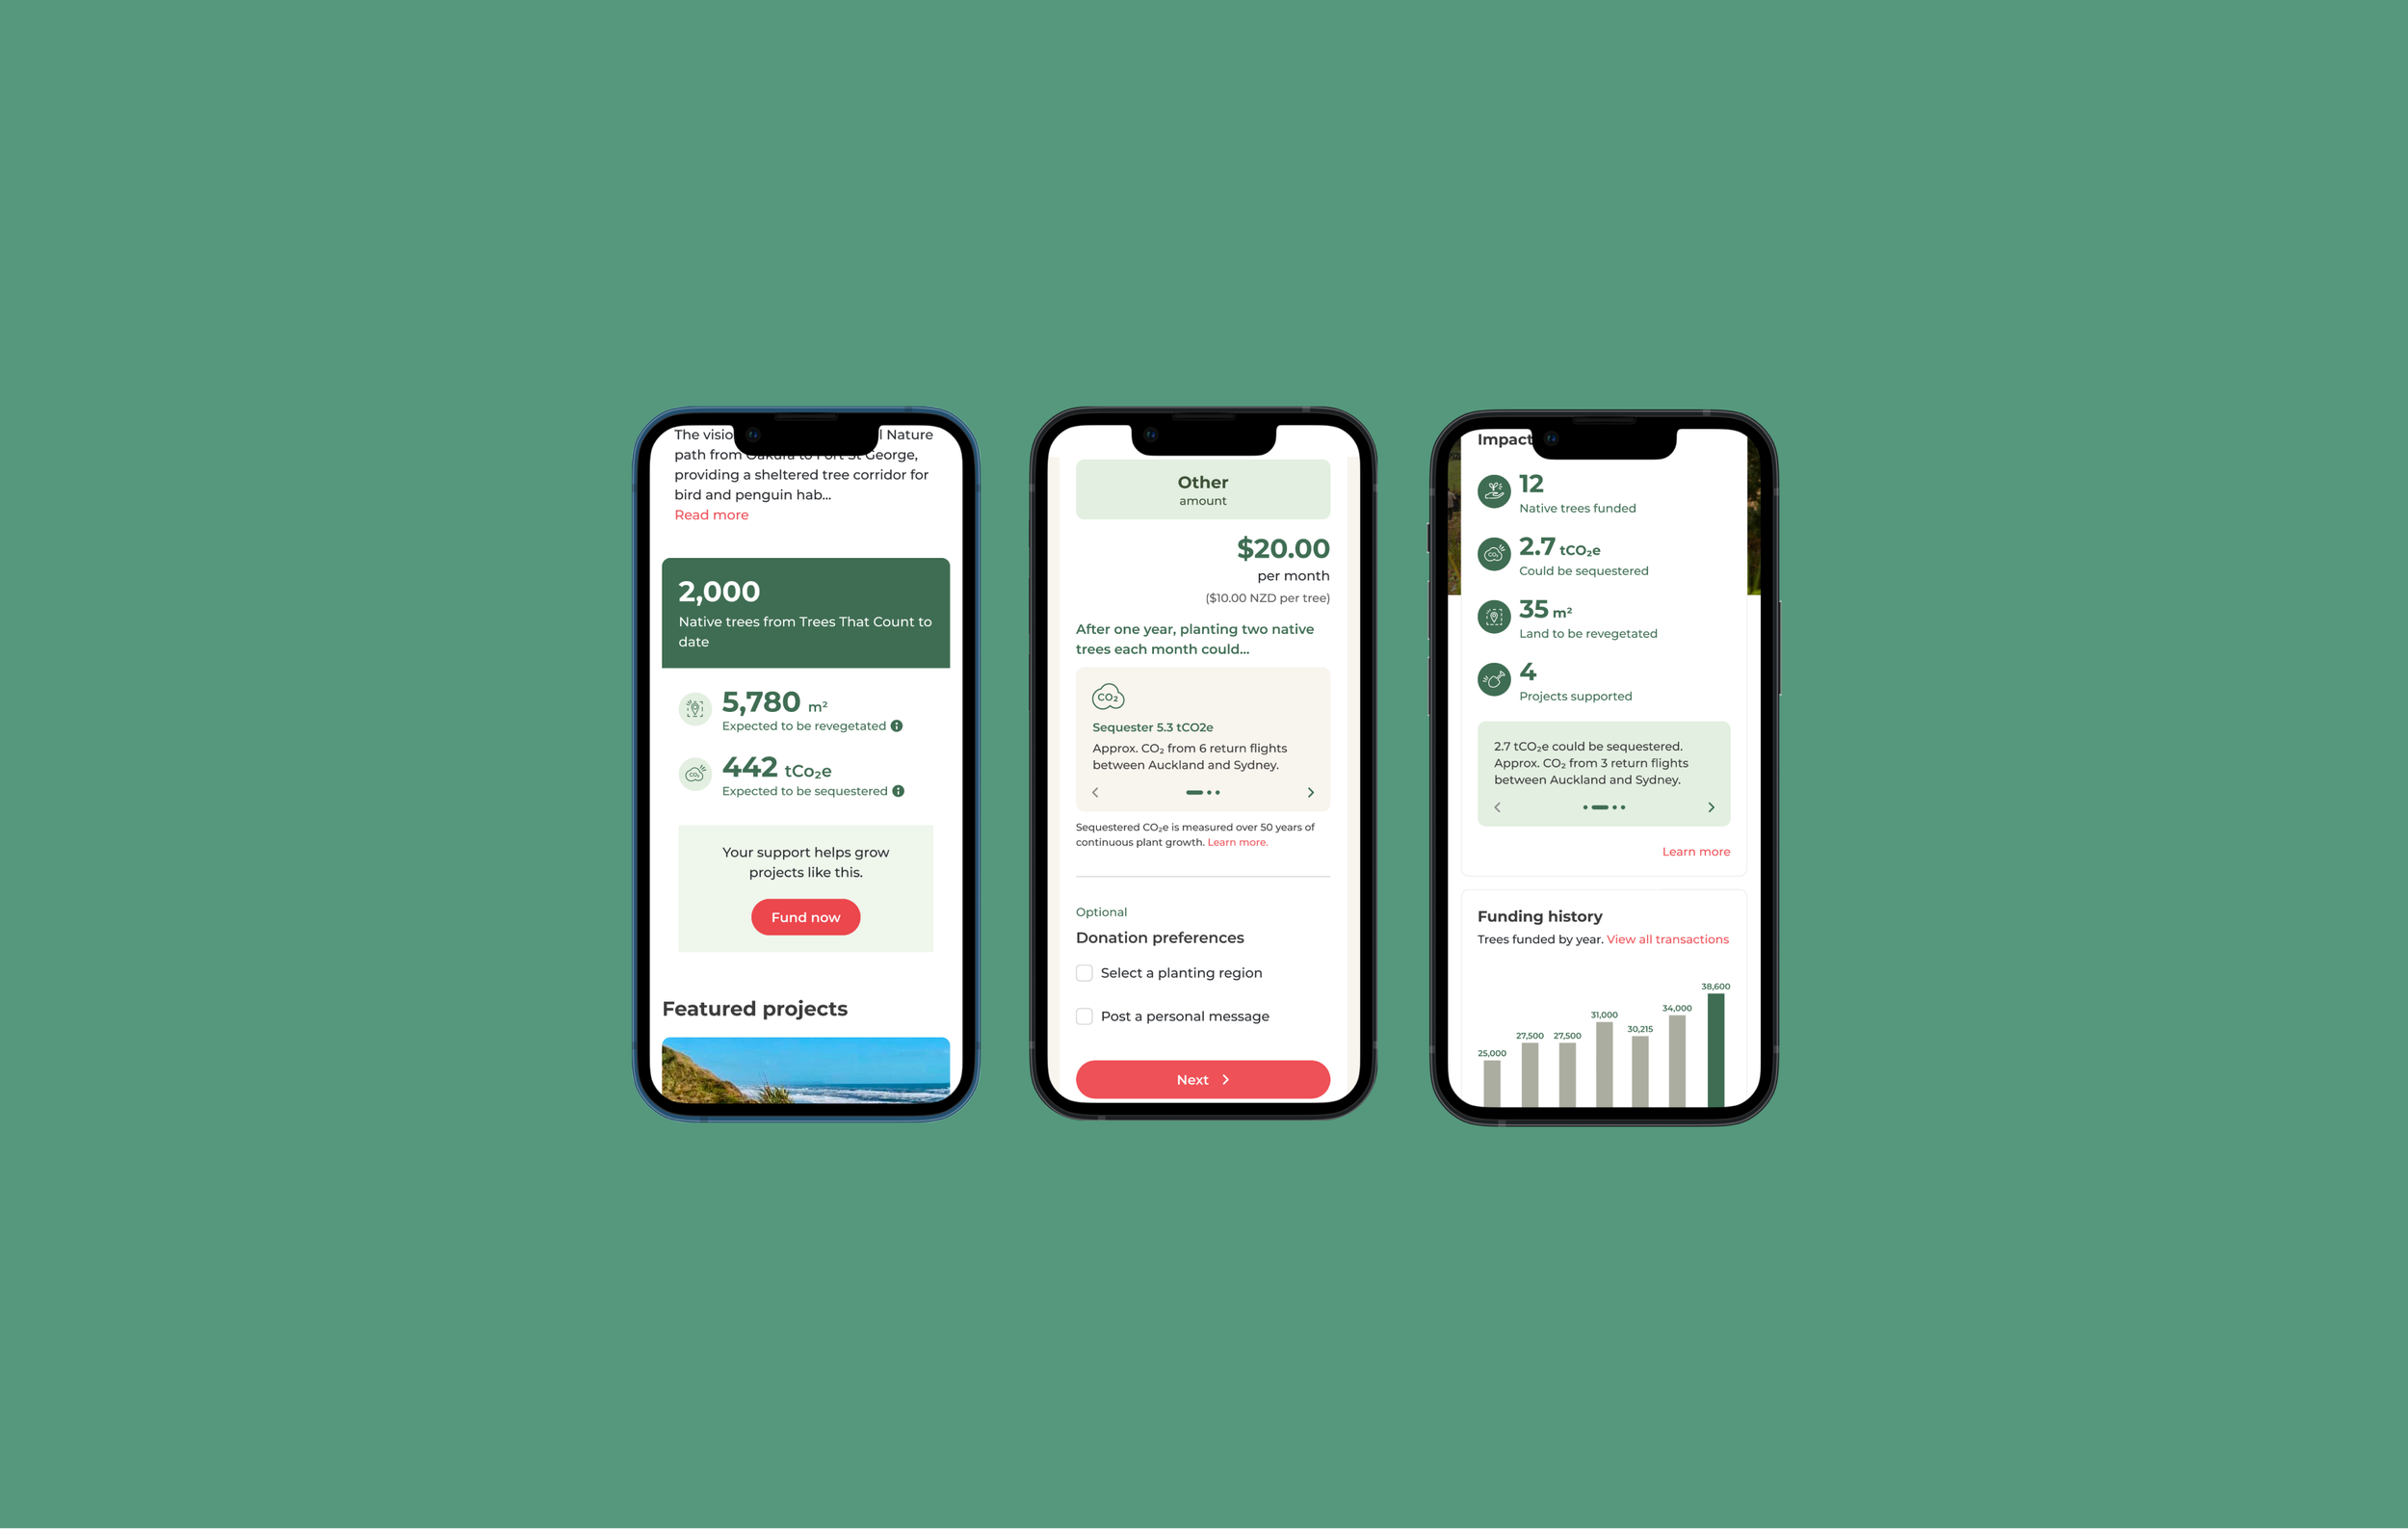
Funnelling funders through impact-driven storytelling
Trees That Count
User Interface (UI) Design
•
User Experience (UX) Design
•
User Research
•
Technical Handover
•
Quality Assurance (QA) Testing
•
User Interface (UI) Design • User Experience (UX) Design • User Research • Technical Handover • Quality Assurance (QA) Testing •
Problem
Funders of Trees That Count (TTC) lacked visibility into the scale and locations of planting projects around New Zealand, making it difficult to understand where their contributions were making an impact.
Some funders even hesitated to donate due to concerns about the legitimacy of the projects and TTC as a charity.
My role
Leveraged insights from existing primary research showing funders’ need for better visibility into TTC’s planting network.
End-to-end product design and delivery of an interactive map view using an existing component to provide snapshot info about planting projects and linking to learn more.
Result
The interactive map improved the engagement of our project pages, with 55% of project page visitors interacting with at least three project elements and 30% creating an account to learn more.
Participants were able to recognise the scale of the Trees That Count planting network when seeing the distribution of projects around the country. One participant stating, “wow, there are so many”.
When interacting with the map, participants often looked at projects nearest to them. Showing an immediate connection with those projects.


